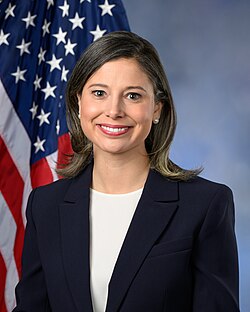
District 1
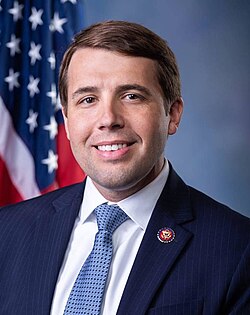
DChris Pappas
54.4%won
average of 3 polls · result 54.0%

RRussell Prescott
38.8%
average of 3 polls · result 45.9%
Difference: 15.6 points
Photos: Chris Pappas, United States Congress, Public domain; Russell Prescott, InfoLogger01, CC BY 4.0. Candidates without a freely licensed photo are shown by initials.
Plain average D+15.6, corrected D+14.7 (±4.5) · 3 pollsters, fieldwork through 2024-11-03
Result: Chris Pappas (D) 54.0% ✓, Russell Prescott (R) 45.9% · D+8.1. The plain poll average missed by 7.6 points toward the Democrat.
| Pollster | Fieldwork | Sample | Result | Margin | ± MOE |
|---|---|---|---|---|---|
| The Dartmouth Poll | 2024-11-01 to 2024-11-03 | 253 LV | Chris Pappas (D) 62.2; Russell Prescott (R) 34.3 | D+27.9 | 11.6 |
| University of New Hampshire Survey Center | 2024-10-29 to 2024-11-02 | 1,433 LV | Chris Pappas (D) 51; Russell Prescott (R) 39 | D+12.0 | 4.9 |
| Saint Anselm College Survey Center | 2024-10-28 to 2024-10-29 | 1,407 LV | Chris Pappas (D) 50; Russell Prescott (R) 43 | D+7.0 | 5.0 |
| The Dartmouth Poll | 2024-10-05 to 2024-10-18 | 977 RV | Chris Pappas (D) 56.8; Russell Prescott (R) 41 | D+15.8 | 6.1 |