District 1 no polls
Predicted D+35.0: the 2024 result (D+25.0) plus the national swing (D+9.9).
In past midterms, predictions this close went that way 100% of the time. A prediction, not a poll (E006).
Predicted D+35.0: the 2024 result (D+25.0) plus the national swing (D+9.9).
In past midterms, predictions this close went that way 100% of the time. A prediction, not a poll (E006).
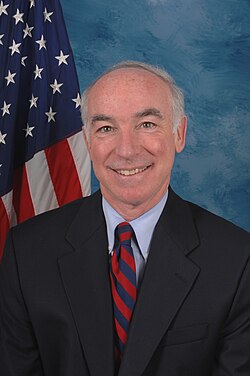
Difference: 19.0 points
Photos: Joe Courtney, Wikimedia Commons, Public domain. Candidates without a freely licensed photo are shown by initials.
Plain average D+19.0, corrected D+19.0 (±10.6) · 1 pollster, fieldwork through 2026-10-19
| Pollster | Fieldwork | Sample | Result | Margin | ± MOE |
|---|---|---|---|---|---|
| DM Strategies | 2026-10-16 to 2026-10-19 | 279 LV | Joe Courtney (D) 52; George Austin (R) 33; No answer (OTH) 1; Undecided (UND) 13 | D+19.0 | 10.6 |
Predicted D+29.3: the 2024 result (D+19.3) plus the national swing (D+9.9).
In past midterms, predictions this close went that way 100% of the time. A prediction, not a poll (E006).
Predicted D+33.6: the 2024 result (D+23.7) plus the national swing (D+9.9).
In past midterms, predictions this close went that way 100% of the time. A prediction, not a poll (E006).
Predicted D+14.1: the 2024 result (D+4.2) plus the national swing (D+9.9).
In past midterms, predictions this close went that way 88% of the time. A prediction, not a poll (E006).
